Apply Geoparsing and Natural Language Procedures on Hamburg parliament database and newsletters in the context of real estate management
Digital City Science, Hafencity University Hamburg
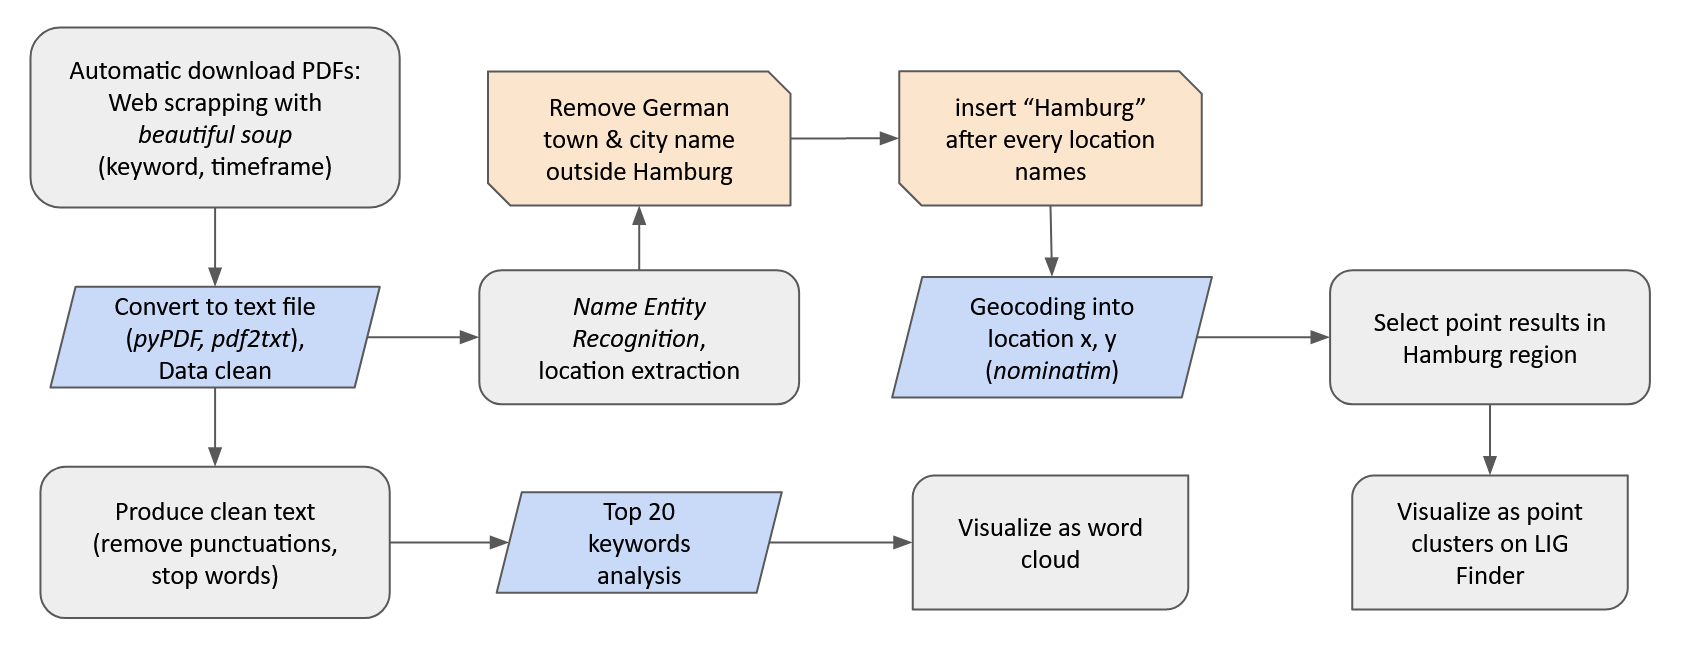
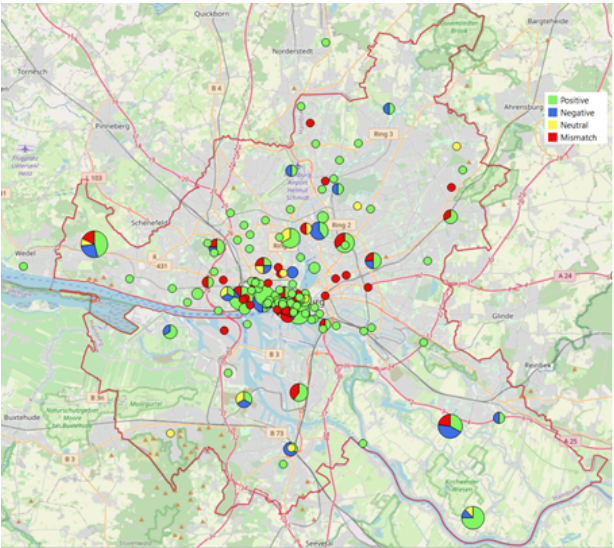
 Geoparsing is the act of transforming from an unstructured free text, with a procedure of text cleaning and location extraction, and further geocoding into geo coordinate.
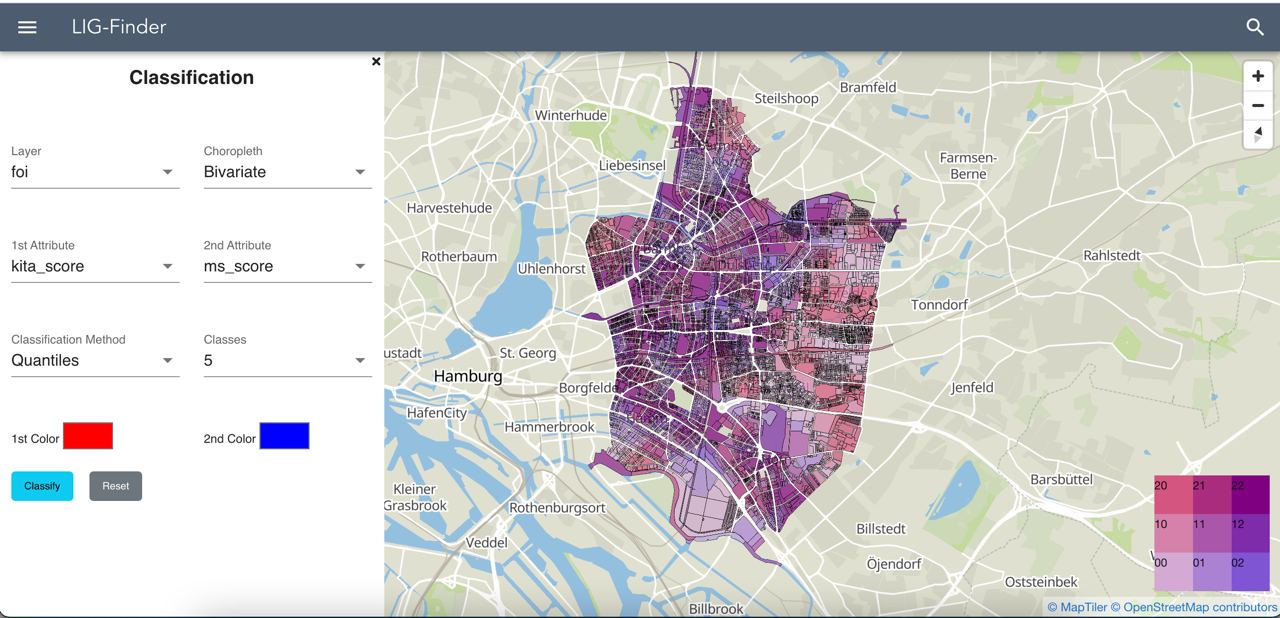
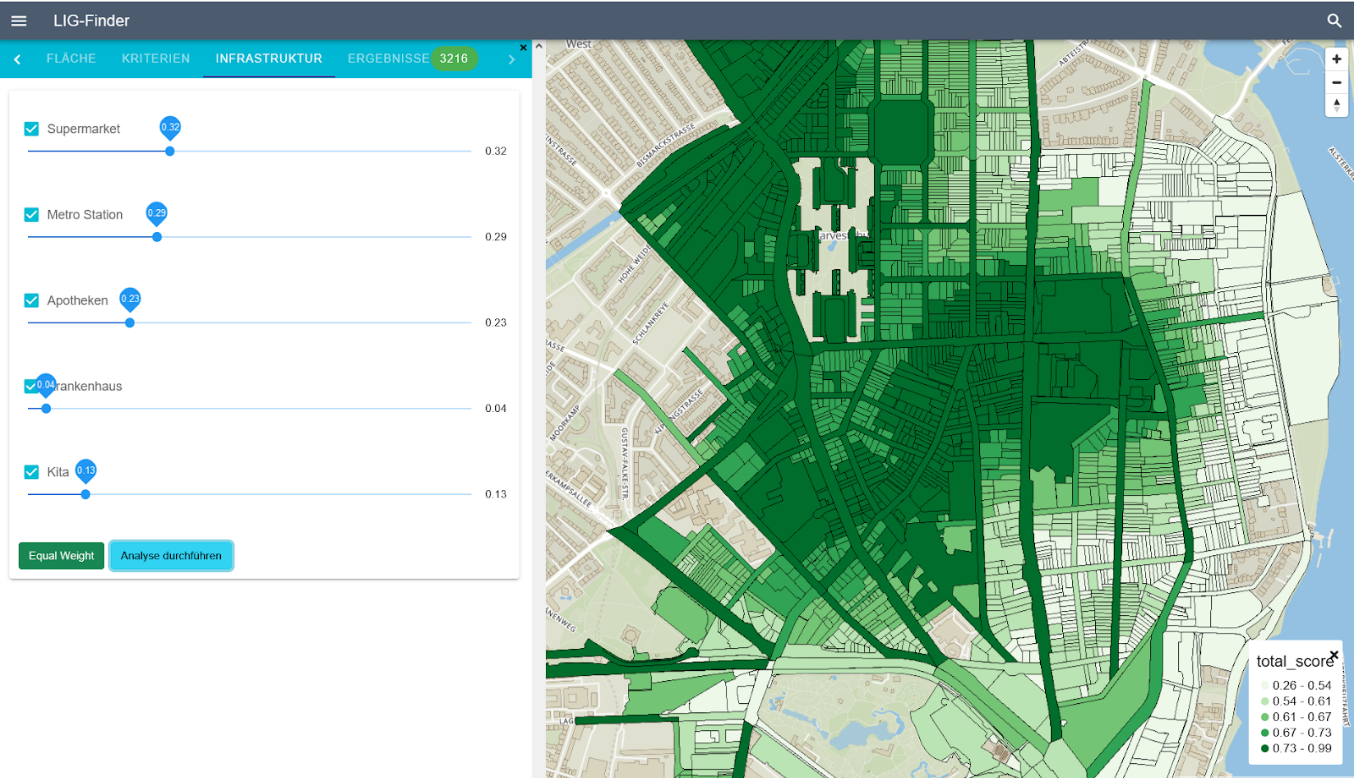
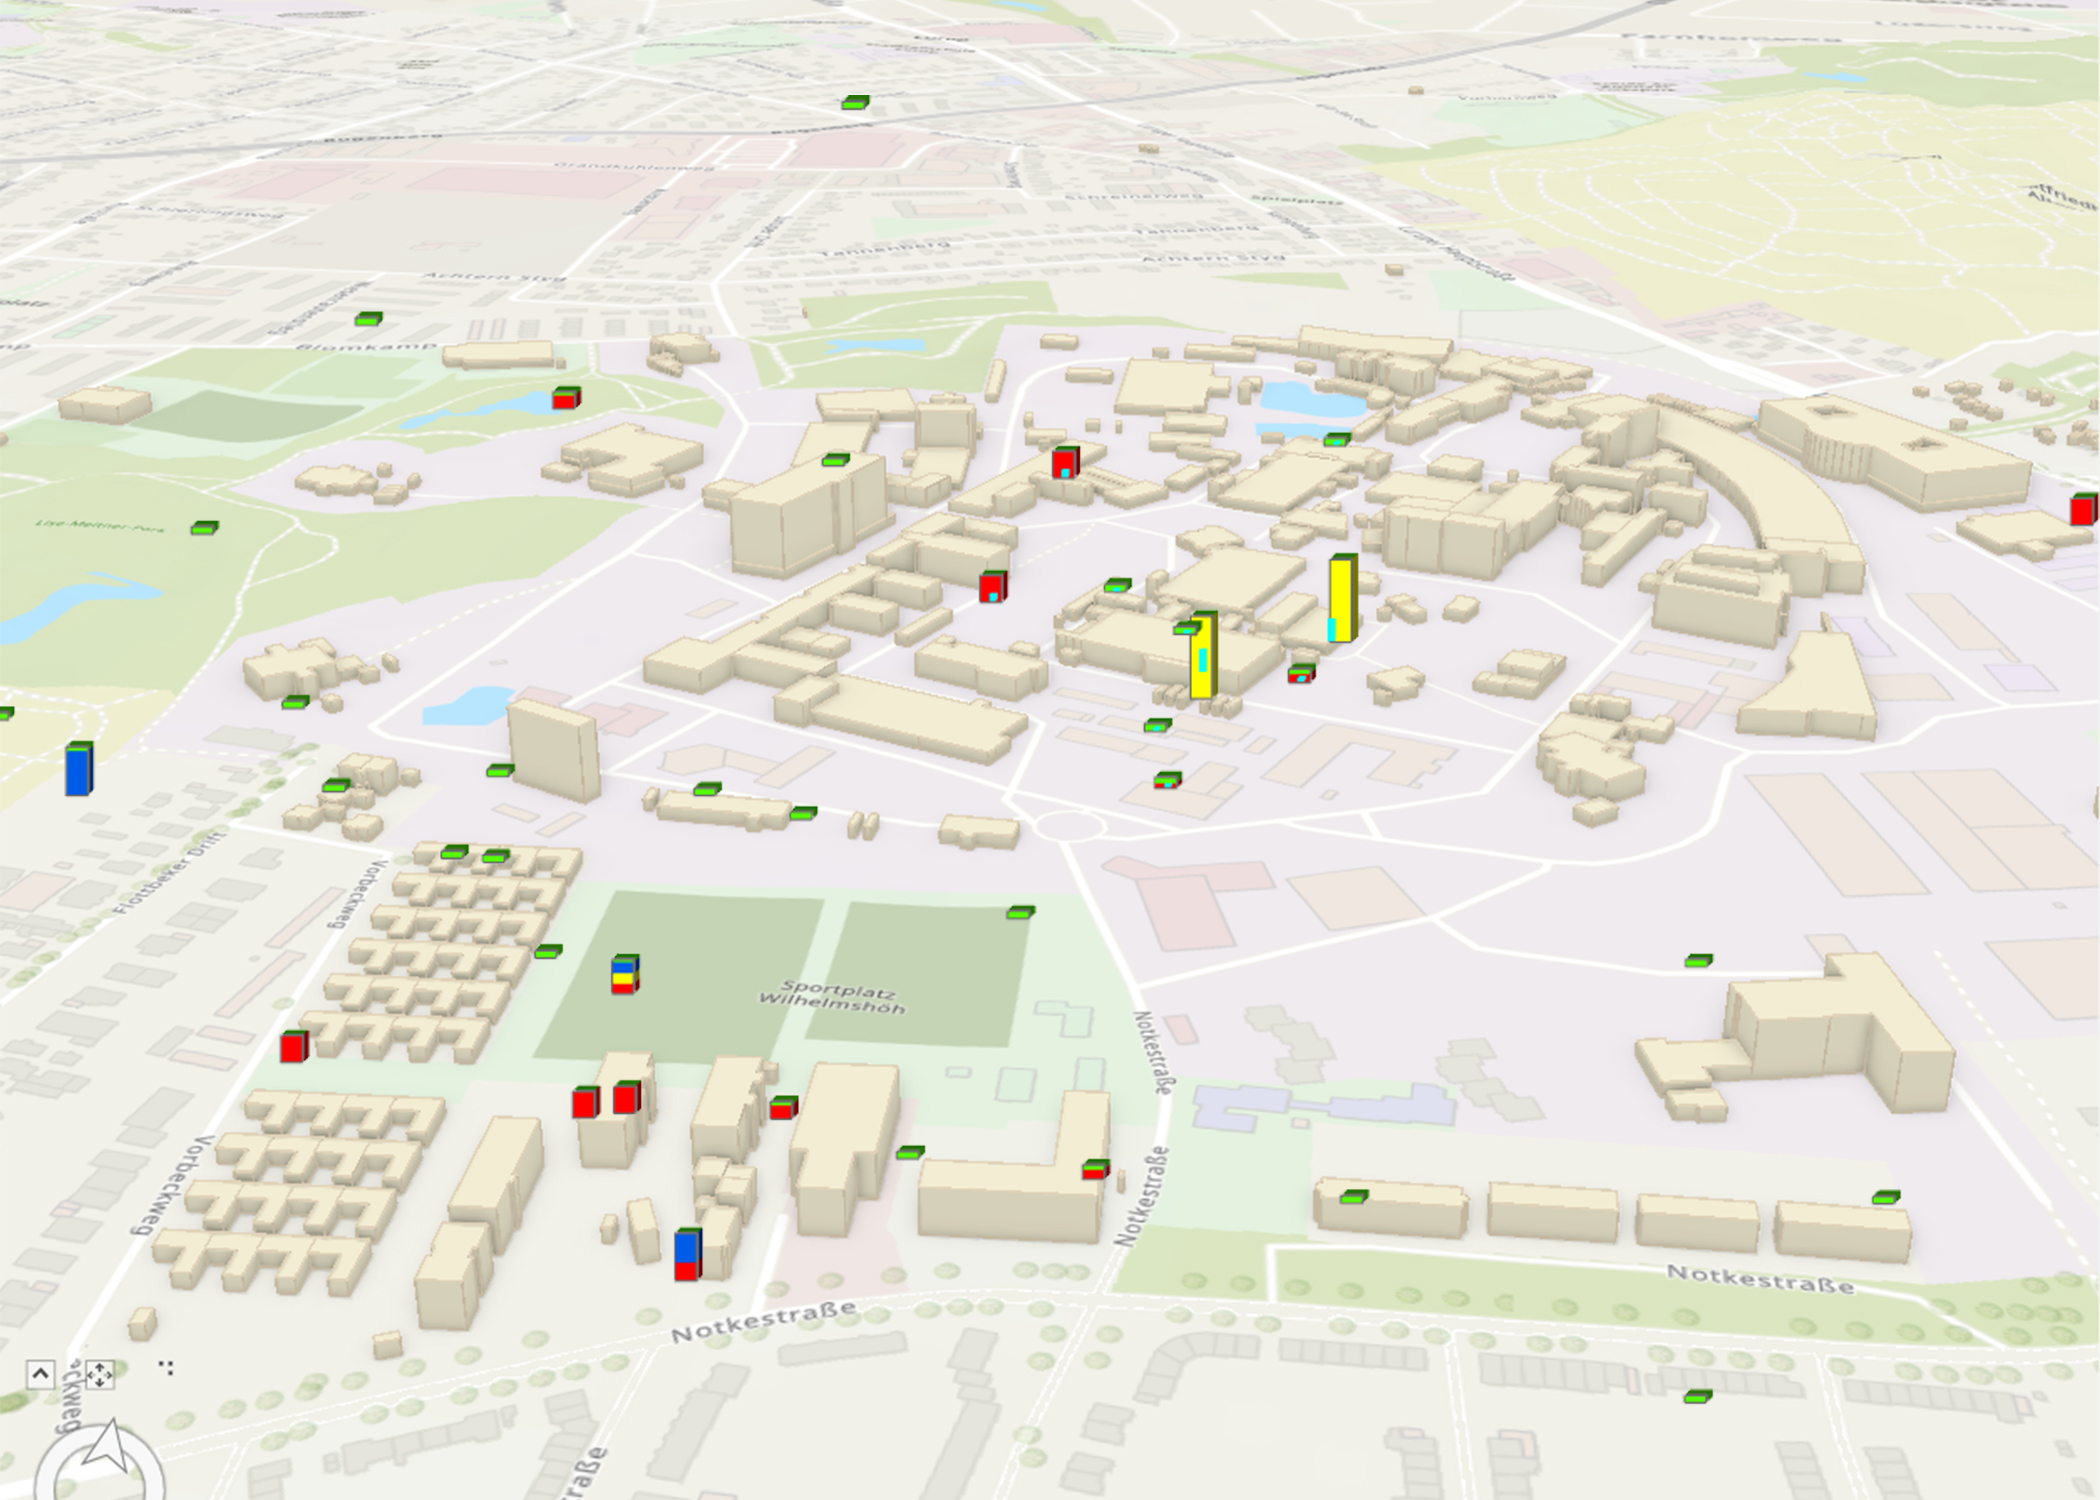
The LIG project is financed by Landesbetrieb Immobilienmanagement und Grundvermögen (LIG). The official real estate management government institution in Hamburg. We, Digital City Science as a research group, have started our corporation since the year 2020. The project began with focusing on building an interactive web tool for site selection. Starting from last year, a geoparsing concept was introduced to the project and we aim to build a semi-automatic process to analyse text data.
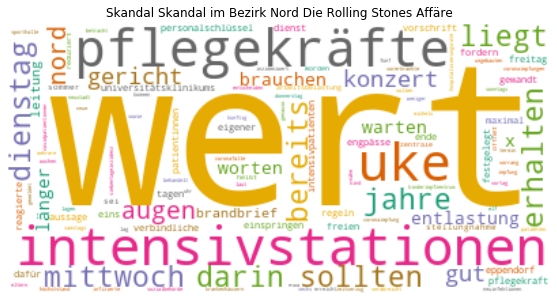
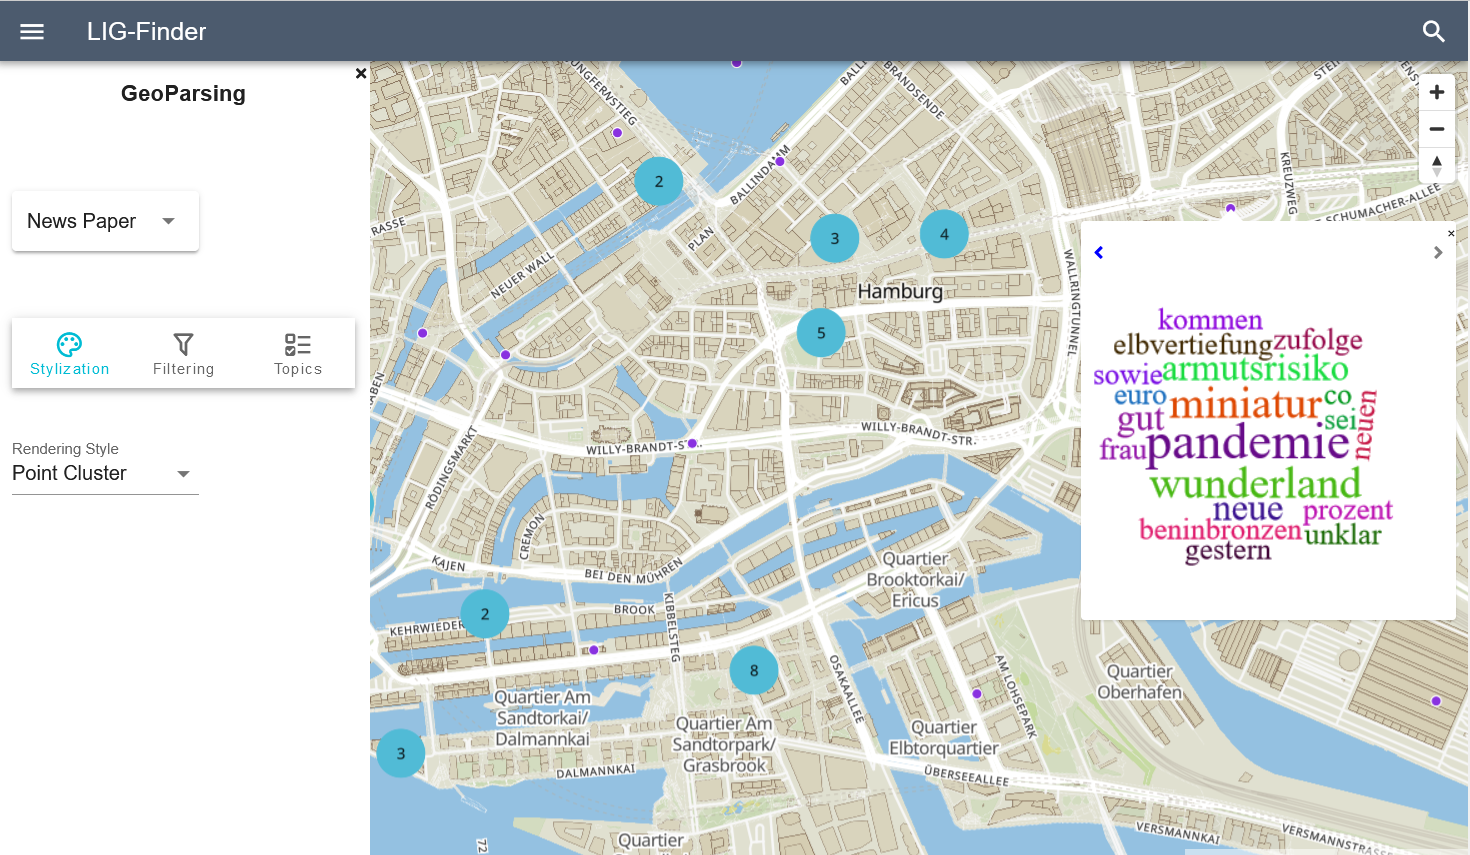
Workflow of Geoparsing